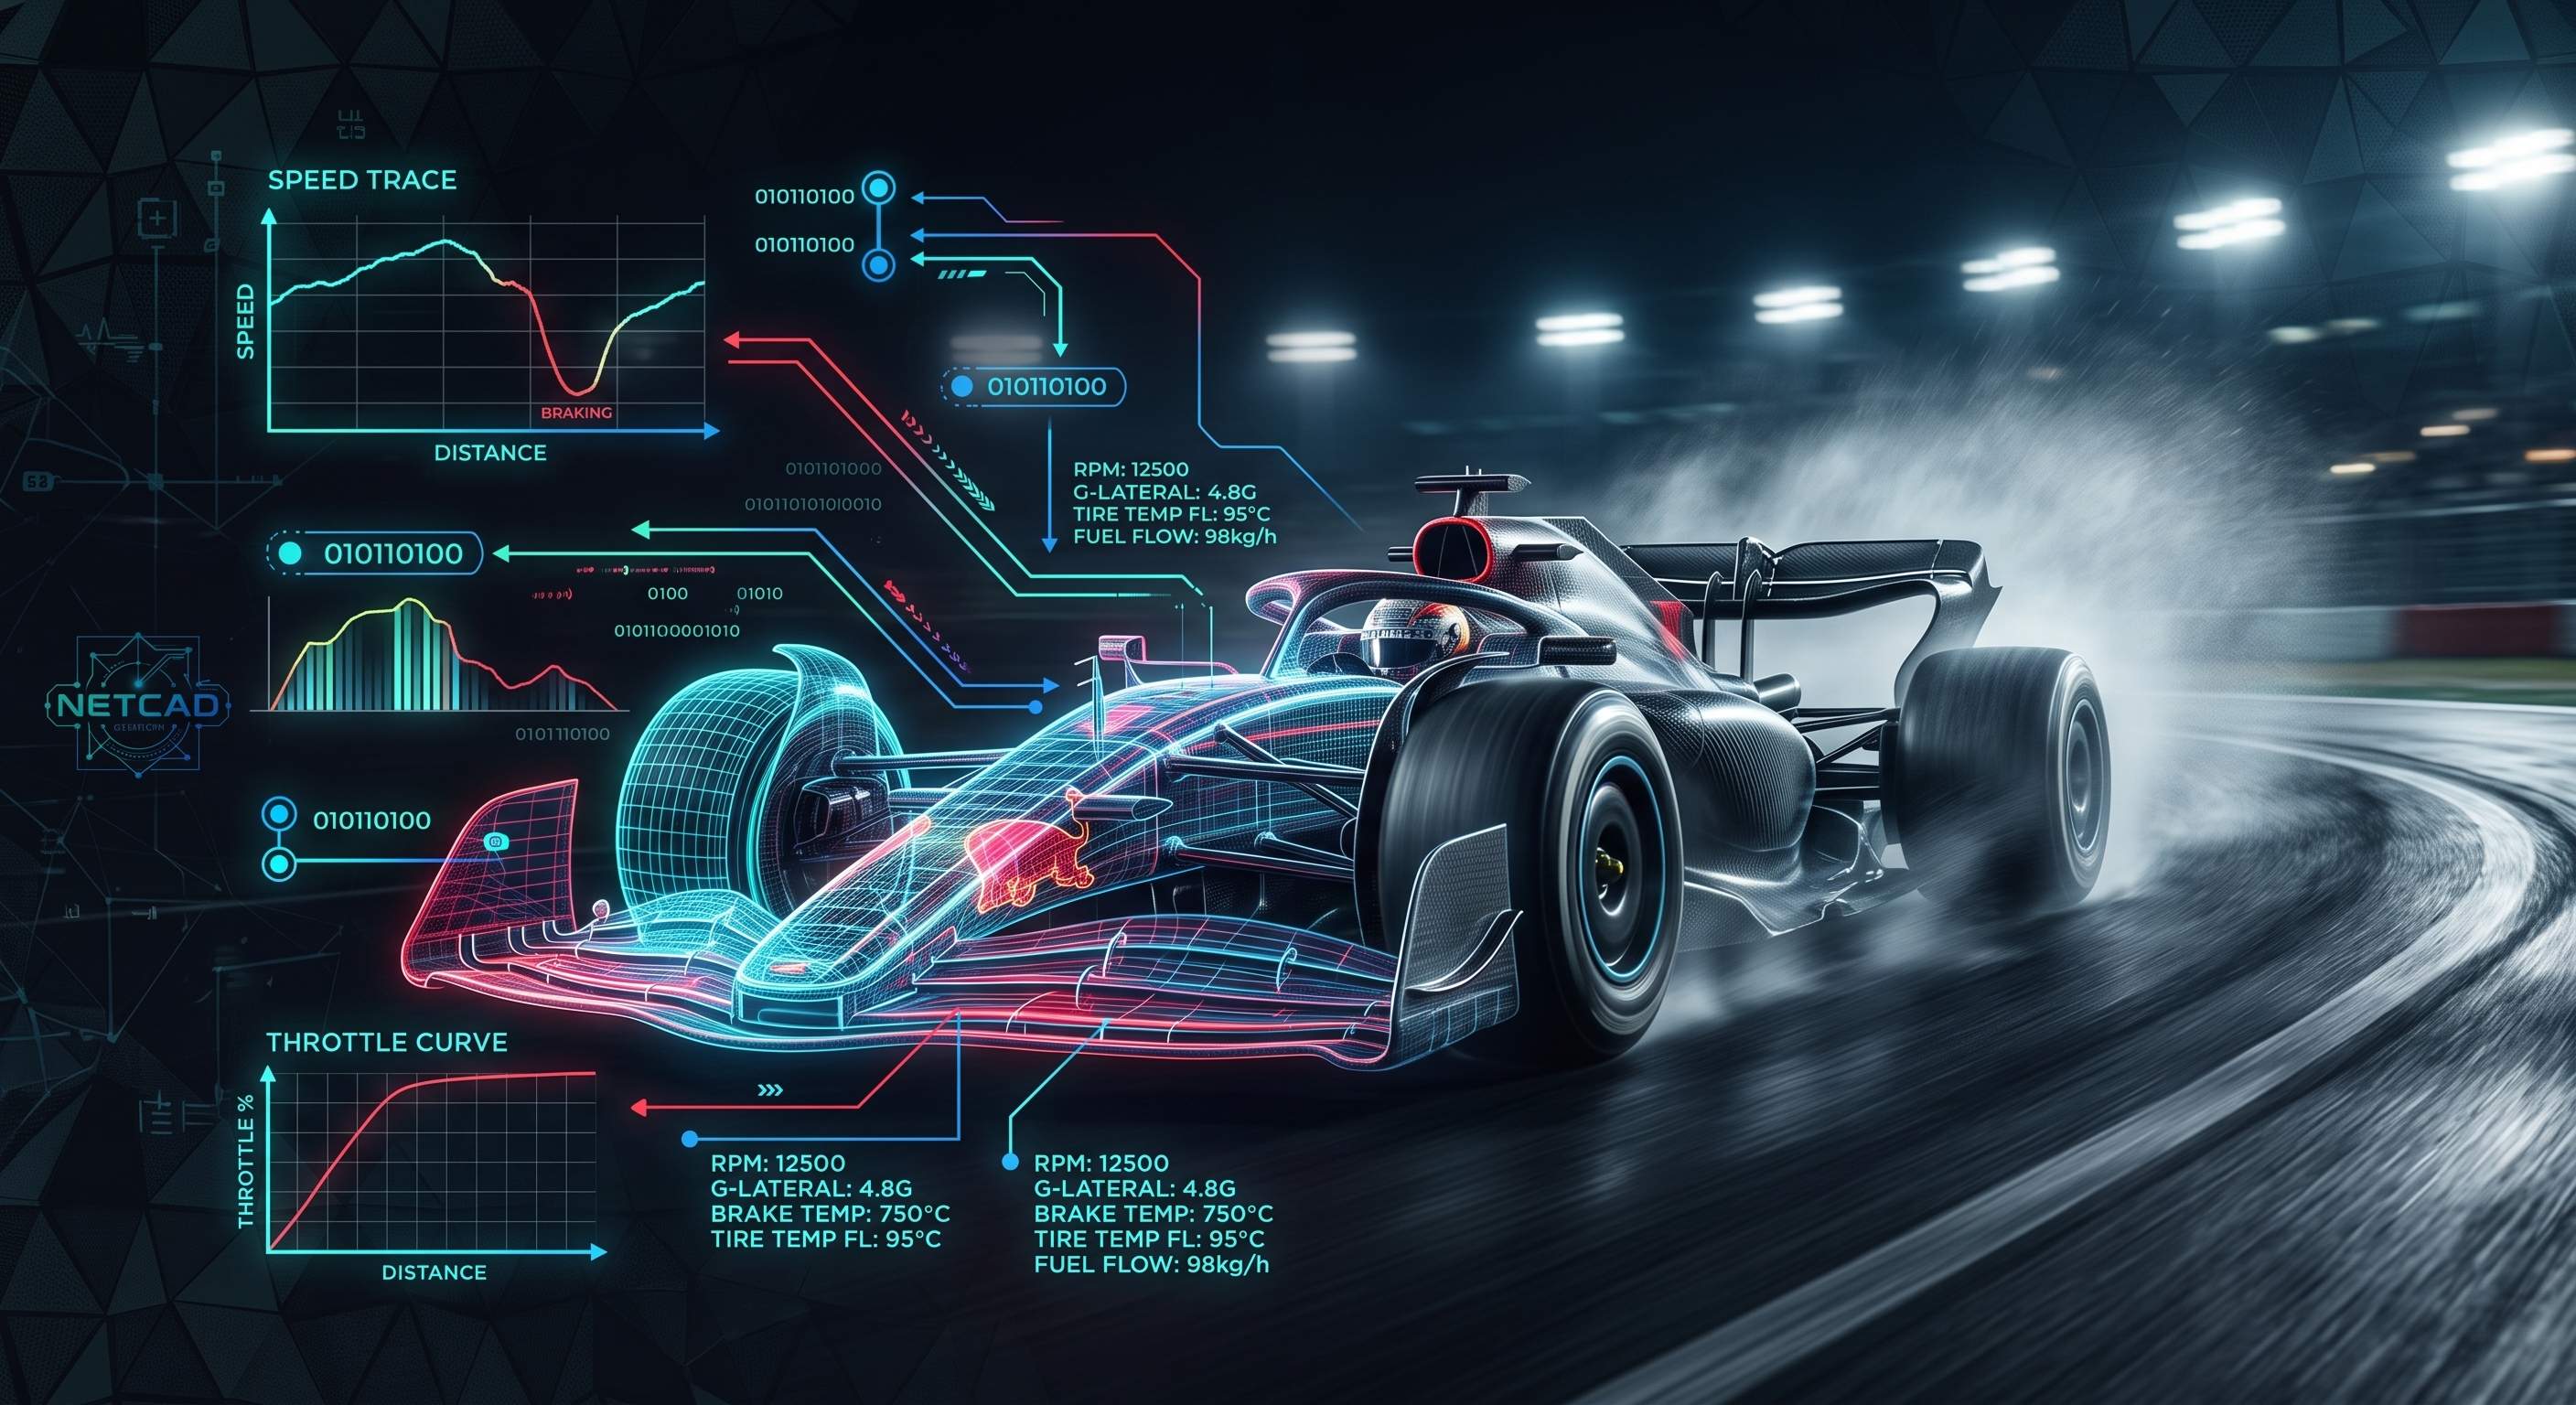
The Engineering Blueprint of Formula 1 Telemetry: From In-Car Sensors to Strategic Advantage
Curriculum: 0 to Hero: F1 Data Science
Topic: Real-Time Automotive Telemetry Pipelines
A Formula 1 car operates as an ultra-high-speed IoT edge system. Reaching speeds exceeding 340 km/h, each chassis houses upwards of 300 physical and virtual sensors, streaming roughly 1.1 million data points per second. Over a full Grand Prix weekend, teams capture, transmit, and process hundreds of gigabytes of mission-critical metrics.
1. The Anatomy of F1 Telemetry Channels
Telemetry represents the instantaneous transmission of sensor measurements taken across three primary operational subsystems:
A. Driver Input Channels
- Throttle Application (
Throttle): Measured as a percentage (0–100%), tracking ramp rate, micro-lifts, and progressive exit throttle. - Braking Metrics (
Brake): Tracked as binary on/off states in FIA public streams, but internally captured as hydraulic brake line pressure (bar) showing trail-braking decay. - Steering Angle & Gear (
nGear): Monitored in degrees alongside instantaneous gear selections to measure driver cornering precision.
B. Chassis & Aerodynamic Dynamics
- Suspension Displacement & Ride Height: Linear potentiometers record travel down to fractions of a millimeter to evaluate aerodynamic porpoising and rake stability.
- Inertial Forces (G-Sensors): Tri-axial accelerometers track longitudinal braking/acceleration loads and lateral cornering forces reaching up to 5.5G.
- Tyre Thermal Profiles: Infrared sensor arrays measure surface, carcass, and inner liner temperatures across all four corners.
C. Power Unit & Energy Management Systems (ERS)
- Internal Combustion Engine (ICE): Real-time engine RPM, fuel mass flow rates (strictly capped by FIA regulations), and manifold temperatures.
- Hybrid Deployment: Energy flow from the MGU-K (Kinetic Motor Generator Unit) and MGU-H (Heat Motor Generator Unit) determining battery State of Charge (SoC).
2. Sensor Telemetry Comparison Reference
| Metric Channel | Primary Unit | Engineering Application | | :--- | :--- | :--- | | Speed | km/h | Straight-line top speed, corner apex speed, and braking initiation points. | | Throttle / Brake | % / Bar | Driver traction confidence, trail braking stability, and throttle pick-up timing. | | DRS Status | Binary (0/1/10/12/14) | Drag reduction deployment validation and overtaking delta analysis. | | Distance / Time Delta | Meters / Seconds | Pinpointing exact track sectors where lap time is won or lost. |
3. The Architecture: Pipeline from Car to Python
The transmission path for F1 telemetry relies on microwave antenna bursts around the circuit, beamed directly from the car's onboard Electronic Control Unit (standardized McLaren Applied TAG-320 ECU) to trackside receivers, then routed to the FIA operations centre and team engineering garages.
Open Telemetry Extraction: Data analysts utilize open-source frameworks like
FastF1to query live timing feeds and FIA historical databases, converting raw streams directly into structured Pandas DataFrames for exploratory analysis.
4. Practical Implementation: Building the Telemetry Extraction Script
Using Google Colab or a local Jupyter Notebook environment, an analyst can extract and plot the speed traces of two rival cars (such as Max Verstappen vs. Charles Leclerc) using the FastF1 library:
# Step 1: Install and import libraries
!pip install fastf1
import fastf1
import fastf1.plotting
from matplotlib import pyplot as plt
# Step 2: Configure caching directory to eliminate redundant downloads
cache_dir = './f1_telemetry_cache'
fastf1.Cache.enable_cache(cache_dir)
# Step 3: Load Qualifying Session
session = fastf1.get_session(2023, 'Bahrain', 'Q')
session.load(telemetry=True)
# Step 4: Extract fastest laps for comparison
ver_lap = session.laps.pick_driver('VER').pick_fastest()
lec_lap = session.laps.pick_driver('LEC').pick_fastest()
# Step 5: Extract synchronized car telemetry and calculate track distance
ver_tel = ver_lap.get_car_data().add_distance()
lec_tel = lec_lap.get_car_data().add_distance()
# Step 6: Generate the Speed Trace Plot
fastf1.plotting.setup_mpl(mpl_timedelta_support=True)
fig, ax = plt.subplots(figsize=(14, 6))
ax.plot(ver_tel['Distance'], ver_tel['Speed'],
color=fastf1.plotting.driver_color('VER'),
label='VER (Red Bull Racing)')
ax.plot(lec_tel['Distance'], lec_tel['Speed'],
color=fastf1.plotting.driver_color('LEC'),
label='LEC (Scuderia Ferrari)')
ax.set_xlabel('Distance (meters)')
ax.set_ylabel('Velocity (km/h)')
ax.set_title('Braking & Apex Delta: Max Verstappen vs. Charles Leclerc')
ax.legend()
plt.show()

---
## 🛠️ Hands-On Python & Jupyter Notebook Telemetry Labs
Download the interactive Python data science notebooks to analyze live telemetry speed traces and tire degradation:
<div style="display: flex; gap: 1rem; flex-wrap: wrap; margin: 1.5rem 0;">
<a href="https://tucvqsutvgwenpzyzdrc.supabase.co/storage/v1/object/public/labs/lydespj84fj_telemetry.ipynb" target="_blank" rel="noopener noreferrer" style="display: inline-flex; align-items: center; gap: 0.5rem; background: var(--accent); color: #000; padding: 12px 20px; border-radius: 8px; font-weight: bold; text-decoration: none;">
⬇️ Telemetry Analysis (.ipynb)
</a>
<a href="https://tucvqsutvgwenpzyzdrc.supabase.co/storage/v1/object/public/labs/5tj15brz04m_0_to_Hero_Ep3_Visualizing_Telemetry.ipynb" target="_blank" rel="noopener noreferrer" style="display: inline-flex; align-items: center; gap: 0.5rem; background: rgba(255,255,255,0.1); color: #fff; border: 1px solid var(--glass-border); padding: 12px 20px; border-radius: 8px; font-weight: bold; text-decoration: none;">
⬇️ Speed Traces Notebook (.ipynb)
</a>
<a href="https://tucvqsutvgwenpzyzdrc.supabase.co/storage/v1/object/public/labs/dyp4q8pcdt_0_to_Hero_Ep4_Tire_Degradation.ipynb" target="_blank" rel="noopener noreferrer" style="display: inline-flex; align-items: center; gap: 0.5rem; background: rgba(255,255,255,0.1); color: #fff; border: 1px solid var(--glass-border); padding: 12px 20px; border-radius: 8px; font-weight: bold; text-decoration: none;">
⬇️ Tire Degradation Notebook (.ipynb)
</a>
</div>